
Category-level demand forecasting is mostly solved. The major planning systems handle seasonality, trend, and baseline volume with reasonable accuracy for most grocery and FMCG categories. SKU-level forecasting is where Australian retailers still lose margin. New product launches with no comparable history, long-tail SKUs moving a few units a week in one state, promotional uplifts that don't match the depth or timing of last year's equivalent — these are the cases where the statistical layer runs out of road.
Claude doesn't replace the existing forecasting stack. It sits above it, handling the contextual layer where pattern-matching on historical data isn't enough. The statistical model gives you a number based on what happened before. Claude gives you a reason why that number might be wrong given the supplier brief that landed last Tuesday, the heatwave forecast for Queensland, or the competitor promotional event running in week three.
Where the statistical layer runs out of road
Statistical models need history and stable conditions to generalise from. Four situations in grocery and FMCG consistently break that assumption:
Promotional uplift forecasting. Statistical models learn from past promotions. They can't read a supplier brief, factor in whether the end-of-aisle placement is stronger this cycle, or interpret whether the advertised price point is sharper than last year. Claude can process all three and produce an adjusted uplift estimate with the drivers named.
Weather and event impact on fresh categories. A cold snap shifts fresh soup volumes 30-40% in the week it hits. Heatwaves move cold beverages hard. Statistical models pick this up after the fact. Claude can anticipate it when the weather window is forecast, not after the sales data comes back.
Long-tail SKU management. A SKU moving 12 units a week in one state has too little history for most statistical approaches. Claude can reason across analogous products, supplier context, and category dynamics to produce a defensible estimate where the model would return a wide confidence interval or nothing at all.
Forecast variance explanation. Category managers spend hours each week reconciling why the model moved. Claude can draft a plain-English explanation of each variance, citing the specific drivers, in under a minute per SKU group. That time goes back into analysis.
What a deployment costs and what it returns
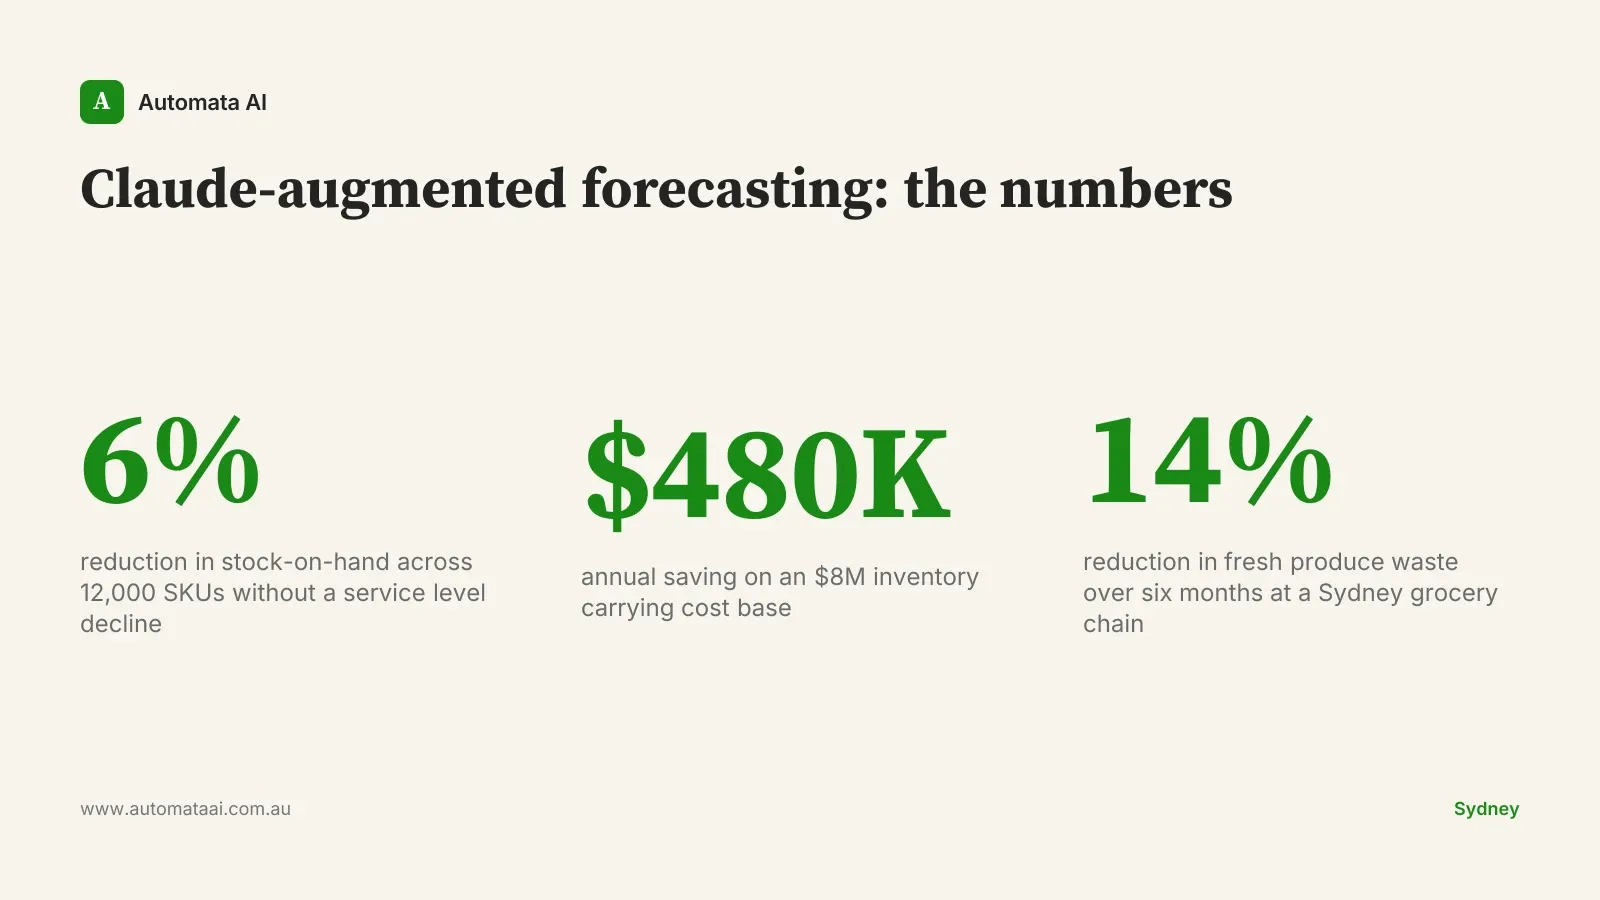
A national Australian FMCG distributor running a Claude-augmented forecasting layer across 12,000 SKUs has reported a 6 percent reduction in stock-on-hand without a corresponding decline in service level. The stock was there when it was needed. It just wasn't accumulating in the wrong places across the range.
At a typical inventory carrying cost of around $8 million for a distributor at that scale, a 6 percent reduction is approximately $480,000 a year. The build, including integration, configuration, and the first three months of planner onboarding, was around $260,000. Payback landed under seven months. You can run the same calculation for your own operation in our ROI Calculator.
The integration shape that limits risk
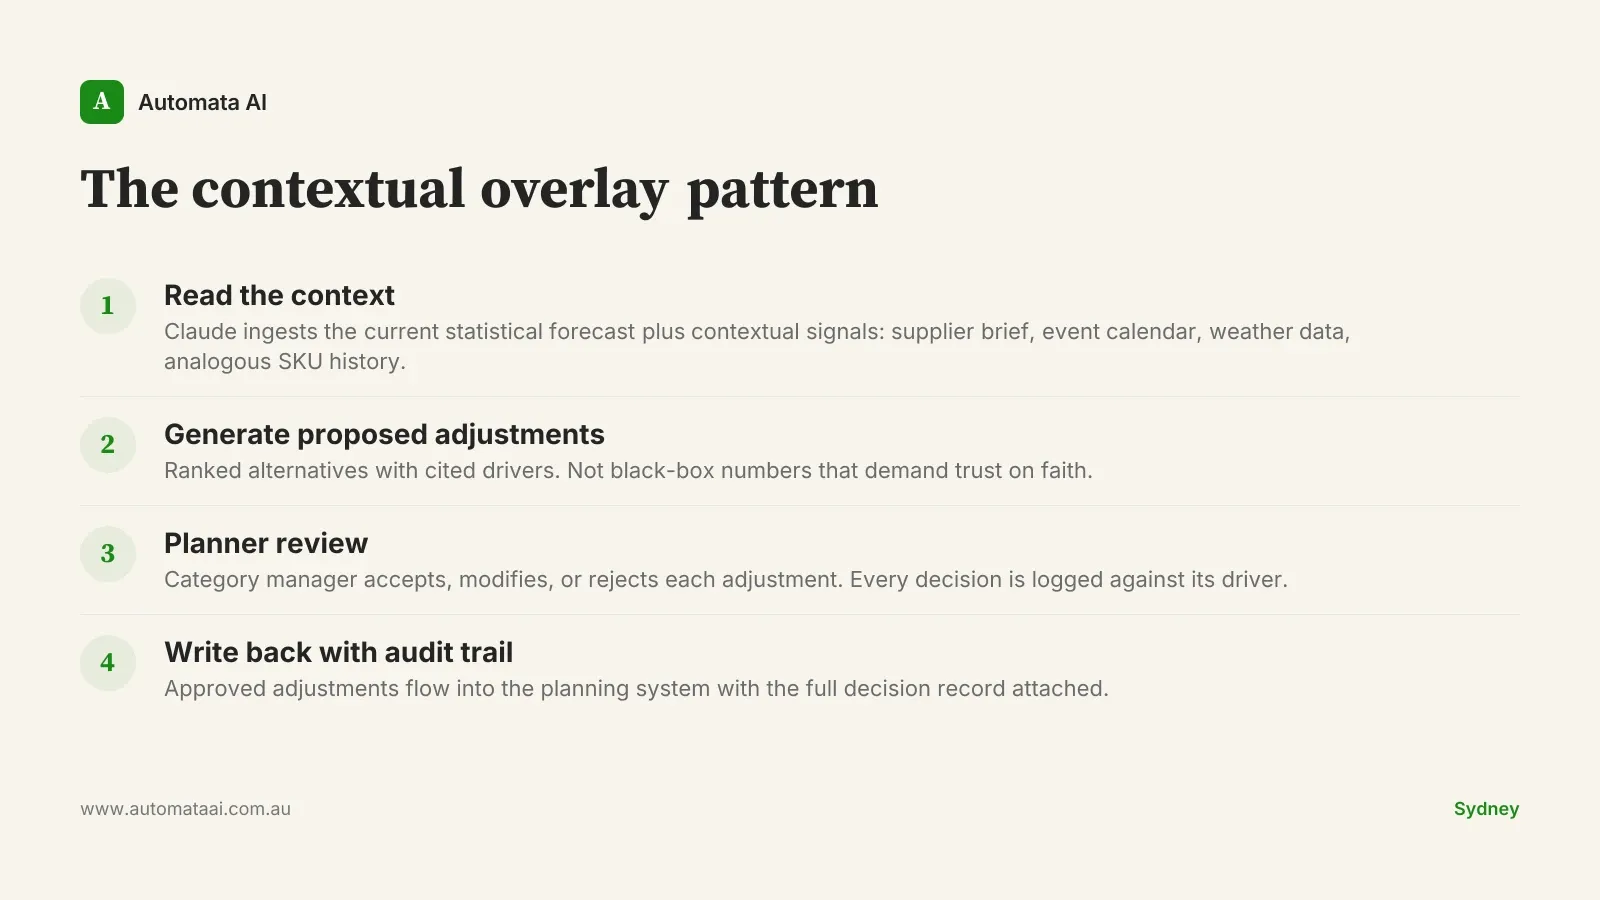
The integration shape, which we call the contextual overlay pattern, works as follows: the Claude layer reads from the demand planning system and writes back proposed adjustments with explanations. Each proposed adjustment includes the driver (promotional brief, weather signal, analogous SKU movement) and a confidence indicator. The planner sees the proposal alongside the current statistical forecast and decides whether to accept, modify, or reject it.
Every decision is logged. Every override is recorded with the reason. This creates a feedback loop that improves calibration over time, and it means the category manager can explain to a buyer, a supplier, or a state manager exactly why stock was built ahead of a promotion. Our AI Automation Services team builds this audit infrastructure into every forecasting engagement from day one. There is no autonomous override of the planning stack.
A Sydney grocery chain running this pattern across the produce category reported a 14 percent reduction in waste over six months. The result that surprised the team wasn't the waste number. It was that category managers came to trust Claude's promotional uplift estimates faster than they had trusted the previous statistical-only model. Because the explanations were verifiable. The model didn't just move the number — it cited the brief.
When to skip the Claude layer
Not every retailer and not every category warrants this investment. The cases where the Claude layer creates noise rather than signal:
Your categories are statistically stable. Mature private-label products in stable categories with five or more years of history and no major promotional disruption will be well-served by the statistical layer alone. Don't add Claude to a problem that's already solved.
Your planning team can't run the review step. The contextual overlay pattern only works because a human reviews every proposed adjustment. If the team is too stretched to hold that discipline, you'll get unreviewed adjustments pushed through, which is worse than the statistical baseline.
Your active SKU portfolio is under 1,000 lines. Below this threshold, the integration and configuration investment typically doesn't clear a two-year payback unless your carrying costs or margins are unusually high. The ROI math doesn't stack up at that scale.
This is the kind of advice most vendors don't offer before you've committed budget. If you're unsure whether your operation fits the model, the AI Readiness Assessment will tell you before you've spent on build.
The category manager owns the forecast
Claude proposes. The category manager decides. This isn't a workflow design choice driven by caution. It's a recognition that the contextual signals Claude can access don't include the supplier relationship, the ranging decision in active negotiation, or the store-level operational constraint the buyer flagged last week. Some of that context lives in the category manager's head and nowhere else.
The retailers that close the SKU-level forecasting gap over the next few years won't necessarily have better statistical models. They'll have better explanations sitting next to those models, and planners who trust those explanations enough to act on them early. That's where the margin difference lives.