A user submits a complex query to your Claude-powered feature. The spinner appears. Twenty-two seconds pass. Nothing visible changes. They reload the page. The query is gone. So is the user.
That's not a hypothetical. It's the default UX for most Australian SaaS teams shipping Claude tool use without streaming. Three patterns close the gap.
Three patterns that keep users in the seat
1. Live tool-call narration
As each tool call fires, show the user a one-line plain-language summary. "Searching your contract database." "Checking compliance requirements." "Drafting the response." These lines appear as the model works, not after it finishes. The user isn't waiting for the answer anymore. They're watching the process. That shift changes what waiting feels like.
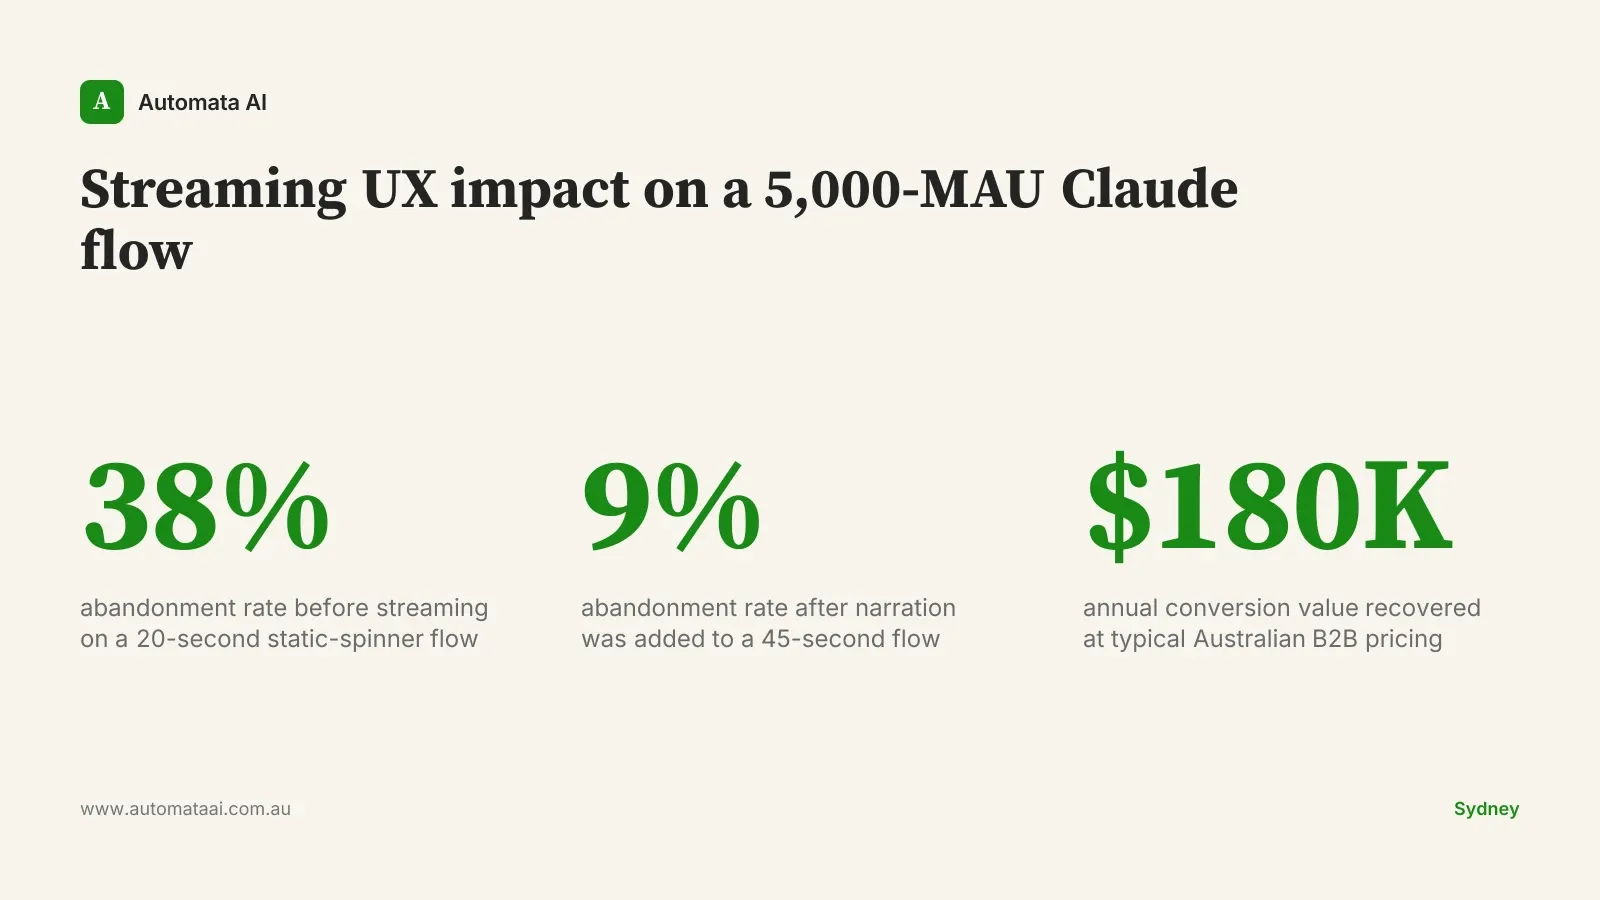
Most teams skip this because internal tool names are ugly — fetch_legal_clauses_v2, run_compliance_check_au — and nobody wants to write a display-name layer. Write the display-name layer. A Melbourne mid-market SaaS measured abandonment at 38% on their pre-streaming agent flow, where users waited 20 seconds on average with a static spinner. After adding three narration lines, abandonment dropped to 9% on a flow that now ran for 45 seconds. The interface worked harder. The wait felt shorter.
2. Partial result rendering
Don't wait for the full response before rendering anything. Pipe the first paragraph to the browser as it streams. The user reads while the rest generates. This is standard in consumer chat products and almost nowhere in B2B SaaS, which means shipping it is a genuine differentiator rather than table stakes.
This is the difference between "loading" and "starting." A user who has read 80 words of a response won't abandon at second 18, even if the full response takes 40 seconds. Their attention is already committed. The moment you give them something to read, the clock resets.
3. Cancel and redirect
Every long-running tool call needs a visible cancel button. More importantly, it needs a redirect option: the ability to add context or change direction without starting over. "Actually, focus on the Sydney office contracts only" should be a mid-flight course correction, not a restart.
Most teams add cancel. Almost none add redirect. Teams that instrument their cancel events find that roughly 30% of cancels are redirects in disguise: users who had more to say, not users who gave up. That 30% is recoverable with a text input and a resume handler. The engineering lift is about a day. The retention lift shows up in weekly active user numbers within two or three cycles.
What the abandonment numbers actually look like
User willingness to wait is roughly proportional to how much the interface looks alive. The Melbourne data point is consistent with what we see across implementations: a 15-second wait with visible progress reliably outperforms a 10-second wait with a static spinner. The perception of responsiveness matters as much as actual speed.
For a SaaS with 5,000 monthly active users on the Claude flow, moving from 38% to 9% abandonment is around $180,000 of annual conversion value at typical Australian B2B pricing. Run the same calculation through the ROI Calculator against your own monthly active user count and average contract value.
The technical shape: four events, not a firehose
Use the Anthropic SDK streaming primitives, not custom polling. The SDK handles connection management and reconnection for you. Pipe the stream through a server-sent events endpoint to the browser and render with a framework that handles partial state cleanly. React's concurrent features are well-suited here. The whole pattern is roughly two weeks of frontend and backend work for an experienced team, less if someone has shipped SSE before.
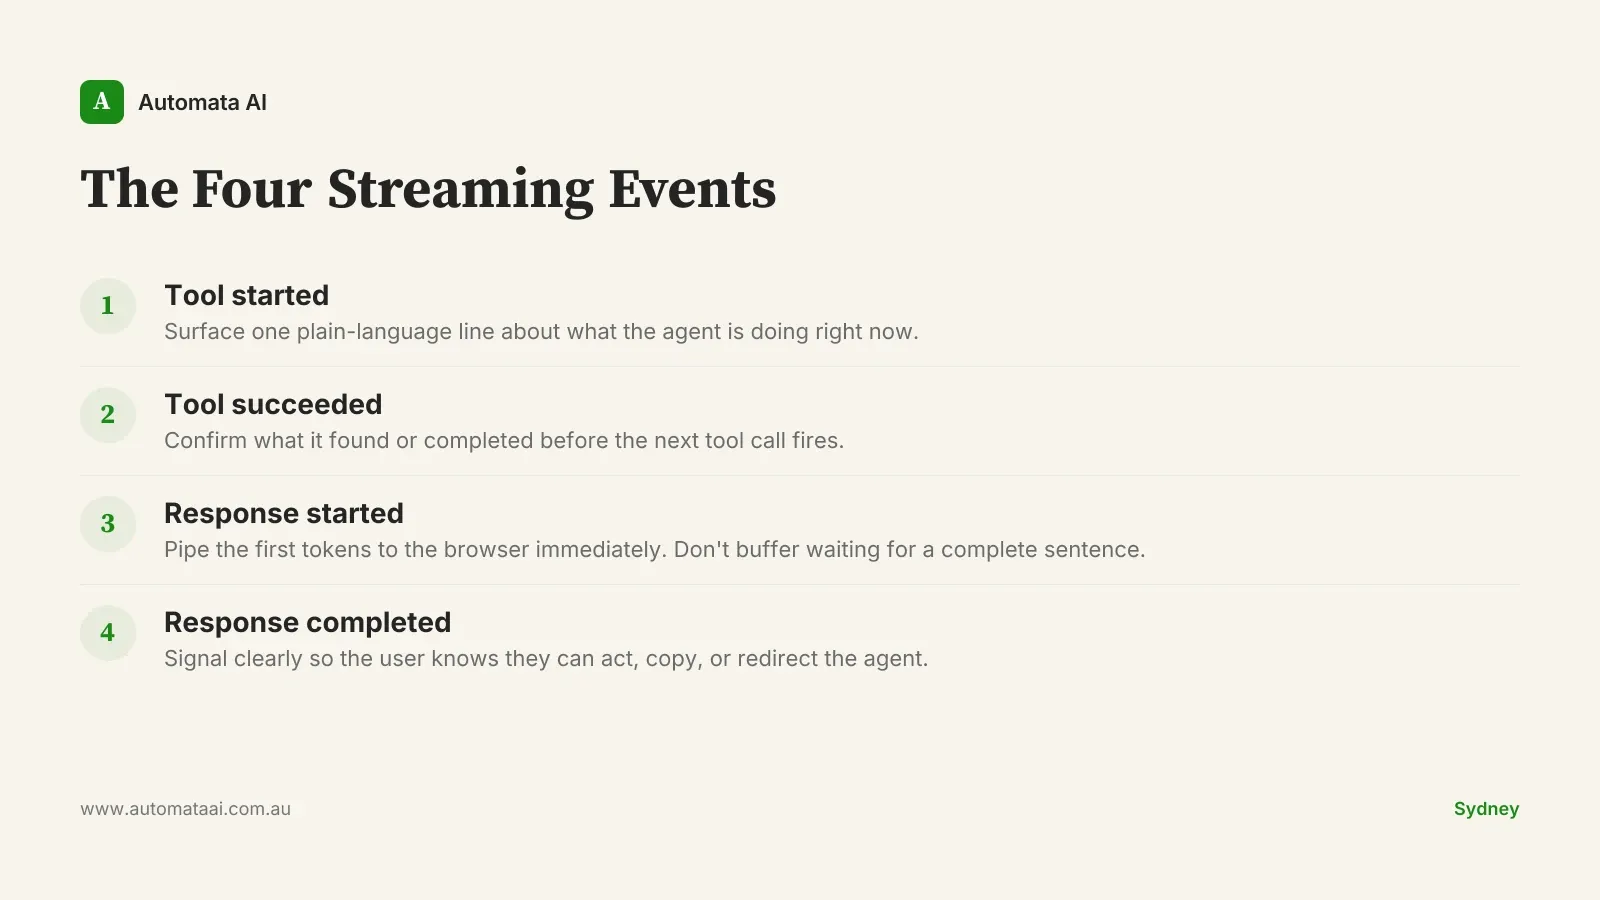
The trap is over-rendering. Streaming every token of a tool call's internal output is noise. What the user needs are four meaningful signals. We call the pattern The Four Streaming Events:
Tool started. One plain-language line describing what the agent is doing right now.
Tool succeeded. A brief confirmation of what it found or completed before the next tool fires.
Response started. First tokens go to the browser immediately. Don't buffer while waiting for a complete sentence.
Response completed. A clear signal so the user knows they can act, copy, or redirect the agent.
That's it. Four events. Everything else is product polish on top of them. The common mistake is adding more: percentage indicators, intermediate data previews, animated transitions between states. Those aren't wrong, but get the four events right first. Our AI Automation Services include this streaming architecture as a standard component, whether you're building in financial services, professional services, or SaaS.
When streaming is the wrong call
Streaming earns its complexity only when the user is actually waiting. A tool call that resolves in under 5 seconds doesn't need narration lines. Adding them creates flicker without feedback value.
Short synchronous tasks. If the entire tool call completes in under 5 seconds, a clean spinner is faster to ship and less distracting to the user.
High-volume background processing. Batch jobs that run overnight don't need streaming UX. They need a completion notification.
Internal-only tooling. If your Claude flow is used by five engineers who understand the pipeline, narration is overhead. Ship it for customer-facing surfaces first.
The pattern also breaks down if your streaming infrastructure adds latency. If the SSE endpoint adds 3 seconds of overhead to every call, you've made the wait longer, not shorter. Benchmark the full round-trip in production conditions before shipping. A staging environment that doesn't reflect production load will give you false confidence.
What to measure from week one
Add three numbers to a shared dashboard before you launch: time-to-first-result on the agent flow, abandonment rate at the 15-second mark, and task completion rate. Without those, the post-launch conversation with your product team or finance is a faith argument. Run the AI Readiness Assessment if you want a framework for instrumenting Claude-powered features before they go live.
A Sydney engineering platform team tracking these metrics found that two flows were burning 40% of their token budget while delivering 10% of task completions. Killing both was a one-day decision once the data existed. The savings were around $120,000 a year. The outliers only became visible because someone had built the dashboard.
Pick one flow where users are currently staring at a spinner for more than 15 seconds. Add narration to that flow this sprint. Measure abandonment before and after. That number funds the next two patterns.