Most Australian SMBs that want a live dashboard get quoted for a business intelligence project. A reporting tool like Power BI, Tableau or Looker, a data warehouse to feed it, and a consultant to wire the two together. The bill often lands between $30,000 and $85,000 in the first year, before anyone has actually looked at a chart. For a team of fifteen people who mostly want to answer the same three questions each morning, that spend is hard to justify.
Claude Cowork artifacts offer a different route. An artifact is a live, self-updating page that reads straight from the tools you already use, and it goes from request to working dashboard inside a single conversation.
What a Cowork artifact actually is
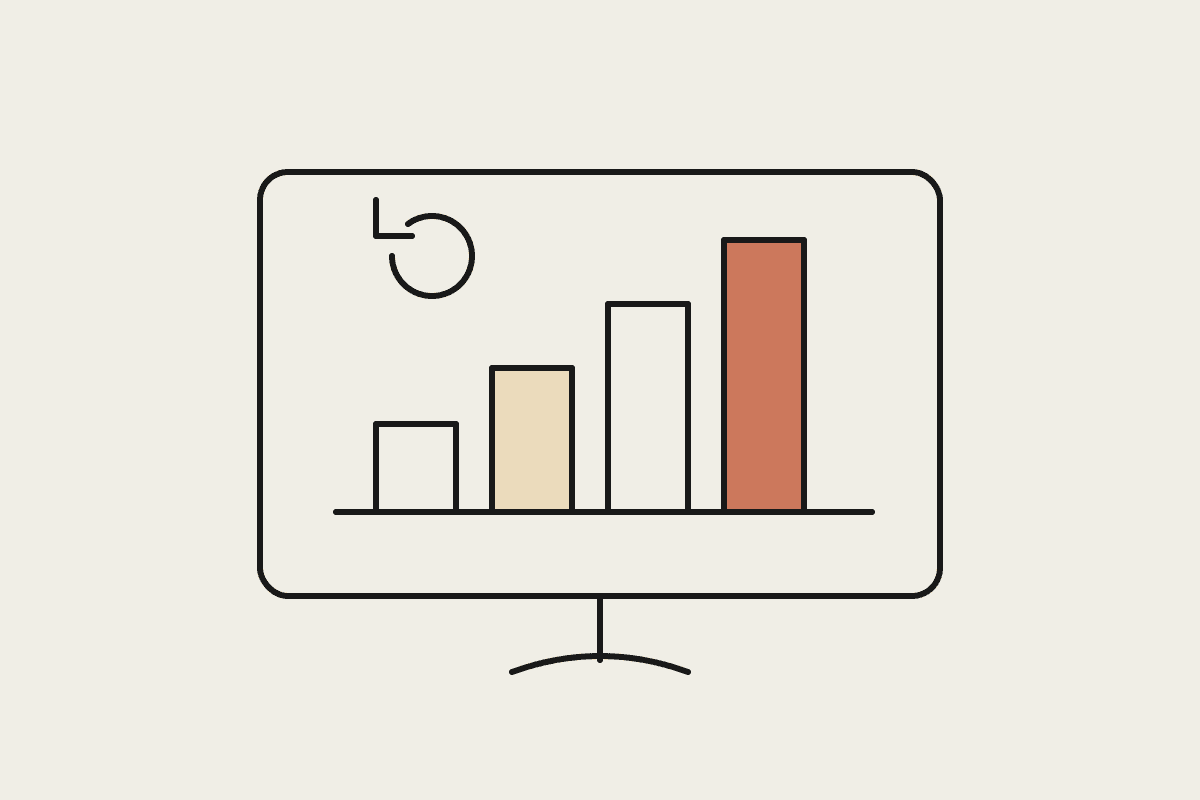
A Cowork artifact is a single self-contained HTML page that Claude writes and saves for you. Two things make it more than a static report. It persists across sessions, so you can reopen it any morning of the week. And each time it opens, it pulls fresh data from your connected tools rather than showing a frozen snapshot from whenever it was made.
Under the surface, the page can call any connector you have linked, whether that is Xero for your accounts, HubSpot for your pipeline, a Notion database, or your Google Calendar, and render the result as a table or a chart. Reads are cached so the page loads quickly, and a built-in Reload button refreshes the numbers on demand. You get what a BI dashboard gives you, without the warehouse, the per-seat licences, or the multi-week build.
Where this beats a full BI stack
Time to first chart: an artifact goes from request to working page in one conversation, not a six-week engagement.
Cost: no per-seat licence and no warehouse bill. A mid-size BI rollout in Australia commonly runs $30,000 to $85,000 in year one, where an artifact costs a fraction of a single consulting day.
Maintenance: when a metric changes, you ask Claude to adjust the page in plain English instead of filing a ticket and waiting on an analytics team.
Access: the page lives in your Cowork space, so there is no new login or tool for staff to learn.
This is not a claim that artifacts replace Tableau for a 500-person enterprise with a dedicated data team and strict governance. What they replace is the reflex to start a BI project every time someone in a Sydney office asks whether a number can go on a screen.
A concrete example
Say a services business wants a morning view of open invoices, this week's meetings, and deals that have gone quiet. In a traditional setup that is three data sources, an extract-and-load job, and a dashboard designer to lay it out. As a Cowork artifact, it is one page that calls the accounting connector for receivables, the calendar connector for the week ahead, and the CRM for stale deals, then arranges them as three summary cards with a chart underneath.
Because the page reruns those calls each time it opens, Monday's view reflects Monday's numbers with no manual export. If the owner later decides overdue invoices should be sorted by age rather than by dollar amount, that is a one-line request in plain English, not a change order with a lead time.
What to keep in mind before you build one
Probe the data first: calling each connector once before building lets the page be shaped around the real response, not an assumption about it.
Charting is limited to three libraries that load cleanly (Chart.js, Grid.js and Mermaid); anything else has to be written inline.
Reads are cached and safe to run on load, but writes such as sending, posting or updating records should stay deliberate and sit behind an explicit click.
An artifact earns its place when the data will be looked at again and changes over time. A one-off number does not need a live page.
When a live dashboard is worth it
The test is simple. If someone on the team asks the same question every week, and the answer lives in a tool Claude can reach, that question deserves a live page rather than a repeated manual pull. Weekly revenue against target, a hiring pipeline, a support queue, a project board: each is a natural fit, and each is the kind of thing businesses currently rebuild by hand every Monday.
There is also a compounding benefit. Once one live page exists, the second and third are cheaper still, because the connectors are already linked and the pattern is understood. A business that starts with a single revenue view often ends up with a small set of pages covering finance, sales and operations, each maintained in plain conversation rather than by a specialist. The cost of that visibility stays low as the number of dashboards grows, which is rarely true of a licensed reporting platform.
If your team keeps re-exporting the same spreadsheet week after week, a Cowork artifact will usually pay for itself inside the first fortnight. We help Australian businesses set these up against their own tools and data, so the dashboard reflects your accounts and your pipeline rather than a template. You can book a short brainstorm to map which of your recurring questions belong on a live page.
Related reading
The end-to-end walkthrough lives in our Claude Cowork setup guide. Closest neighbours to this piece: