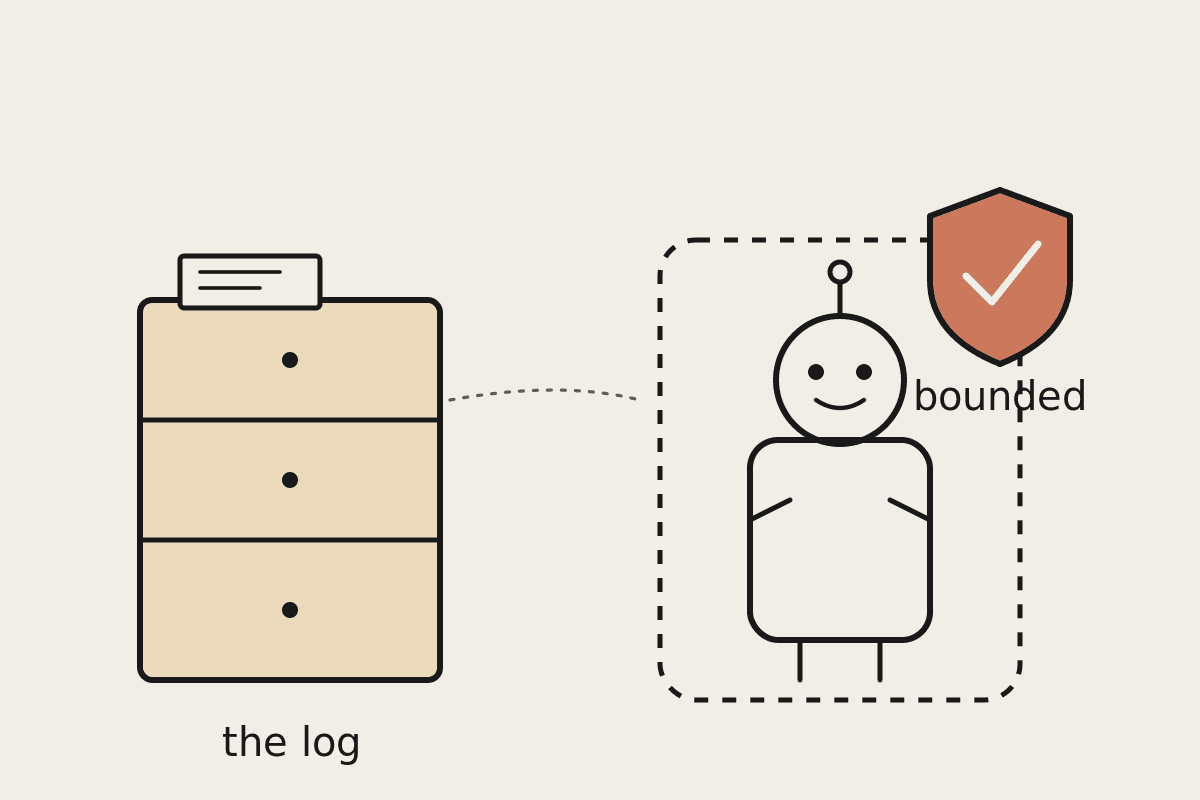
If you publish a Claude connector, you have probably been flying blind. Until now there was no first-class way to see whether anyone was using your MCP server, which of its tools were failing, or how it behaved once it left your own test account. Claude's new connector observability changes that. Published connectors in the directory now get a dashboard that reports performance across every Claude surface, and you can submit a new MCP server to the directory without leaving the app.
The feature arrived in public beta in June 2026. For the growing number of Australian teams building connectors, whether for internal tooling or for the public directory, it closes a gap that has made connectors genuinely hard to operate with any confidence.
What the connector dashboard shows
Open Claude, go to Organization settings, and find the Directory section. Each connector you own now has a dashboard built around three plain questions: is anyone using it, is it healthy, and where is it being used. The data is grouped to answer each of those directly.
Adoption: active users, total tool calls, and your directory rank over time, so you can see whether a release actually moved the needle.
Errors and latency: a single health score, the overall error rate, and latency at a glance, plus a per-tool error breakdown that points to the exact tool that is failing.
Usage by product: tool calls split across Claude, Claude Code, Cowork and other surfaces, so you can tell where people are reaching for your connector and where they are not.
The per-tool breakdown is the part most teams will use daily. A connector can pass every test in isolation and still fail in production because one tool times out under real load or returns malformed data for an edge case nobody tried. Seeing error rate by tool turns a vague report that something is broken into a specific line of code to fix.
Directory rank matters more than it first appears. If you publish publicly, rank is the closest thing to a market signal you get: it tells you how your connector is doing against the 300-plus others competing for the same attention. Watching rank move after a change is a quick read on whether the work paid off.
Who can access it
Observability is not switched on for every account. You need a Team or Enterprise plan, and within that, Admin or Owner access. Enterprise customers can also grant a custom role that holds the Libraries permission, which is the cleaner option if you do not want to hand a developer full Owner rights just to read connector metrics.
That access model matters for Australian businesses with privacy obligations. Under the Privacy Act, you want the smallest possible set of people holding administrative control over systems that touch customer data. A custom role scoped to Libraries lets your connector team watch performance without sitting inside the same permission set that can change billing or remove users.
Why observability is worth the setup for AU teams
A connector that fails quietly is expensive. Picture a Sydney professional services firm that ships an internal MCP connector to its document store so staff can ask Claude to pull the right precedent. If a single tool starts returning errors and nobody notices for three weeks, the cost is not just the engineering time to trace it. It is the hours staff spend working around a broken tool, and the slow loss of trust that makes them stop using it at all. We have watched that quiet failure pattern undo a $45,000 internal build in under a quarter, because adoption never recovered once people decided the tool could not be relied on.
Observability turns that from a guessing game into a number you watch. If your health score drops on a Tuesday, you know before your users file a complaint. For a connector that hundreds of staff depend on, catching one bad deploy early can be the difference between a 20 minute rollback and a $120K productivity hole over the weeks it takes people to notice and report it.
There is a compliance angle too. If your connector reaches regulated data, being able to show error rates, latency and usage over time is the kind of evidence an APRA-regulated customer or an internal risk team will ask for. Observability data is not a full audit trail, but it is a strong start, and it is far better than the alternative of having nothing to point to.
Submitting your MCP server to the directory
Connectors are built on the Model Context Protocol, the open standard Claude uses to talk to outside tools and data. There are already more than 300 third-party connectors in the directory, used by millions of people every day. You can now submit your own MCP server to that directory directly inside Claude, rather than going through a separate channel.
If you are weighing whether to list publicly, the new dashboard is the reason to do it properly. A directory listing without observability is a connector you cannot really support. With the dashboard, you can treat a public connector the way you would treat any production service: watch adoption, respond to error spikes, and decide what to build next based on which tools people actually call.
Where to start
If you already own a connector, the first move is to turn on observability and read the per-tool error breakdown before anything else. It usually surfaces at least one problem you did not know you had. If you are about to build one, design for it from day one: keep tools small and single-purpose, so the health metrics tell you something precise when one of them misbehaves rather than burying the signal in a single overloaded endpoint.
We help Australian teams build, instrument and ship Claude connectors that hold up in production. If you want a second set of eyes on your connector before it goes into the directory, book a brainstorm and we will walk through your setup.