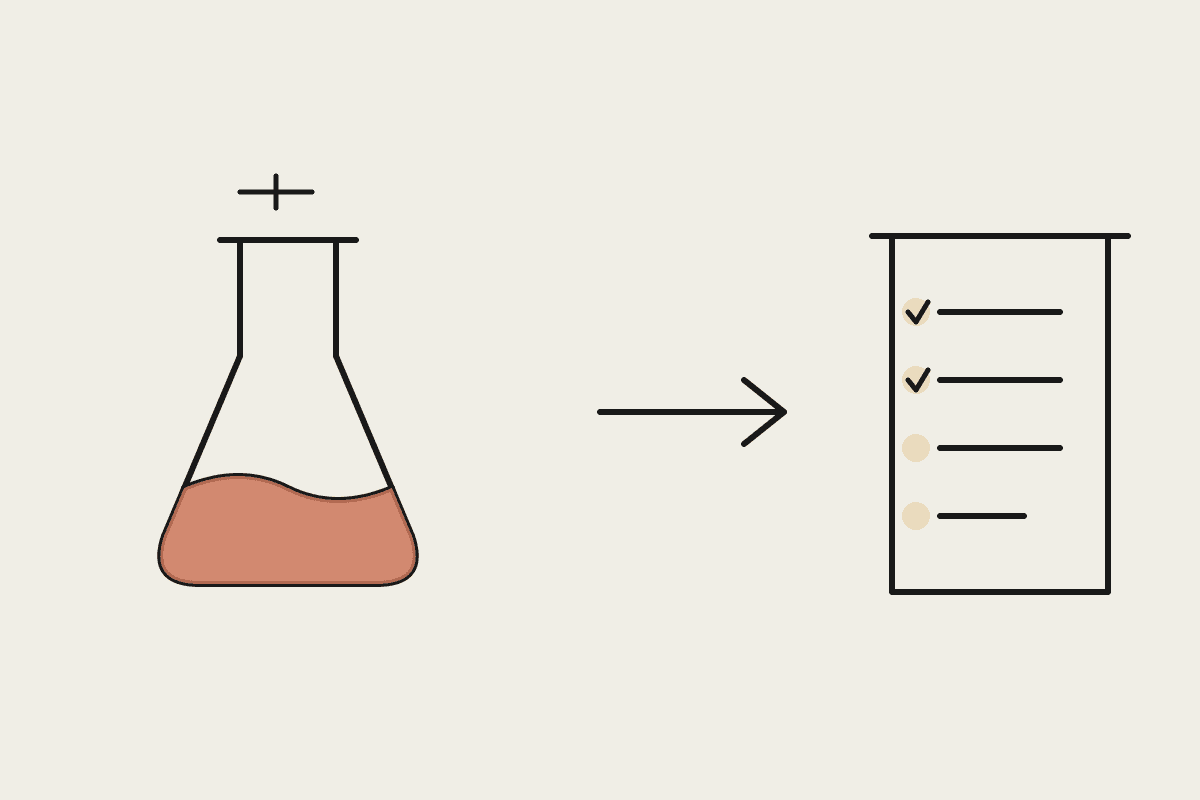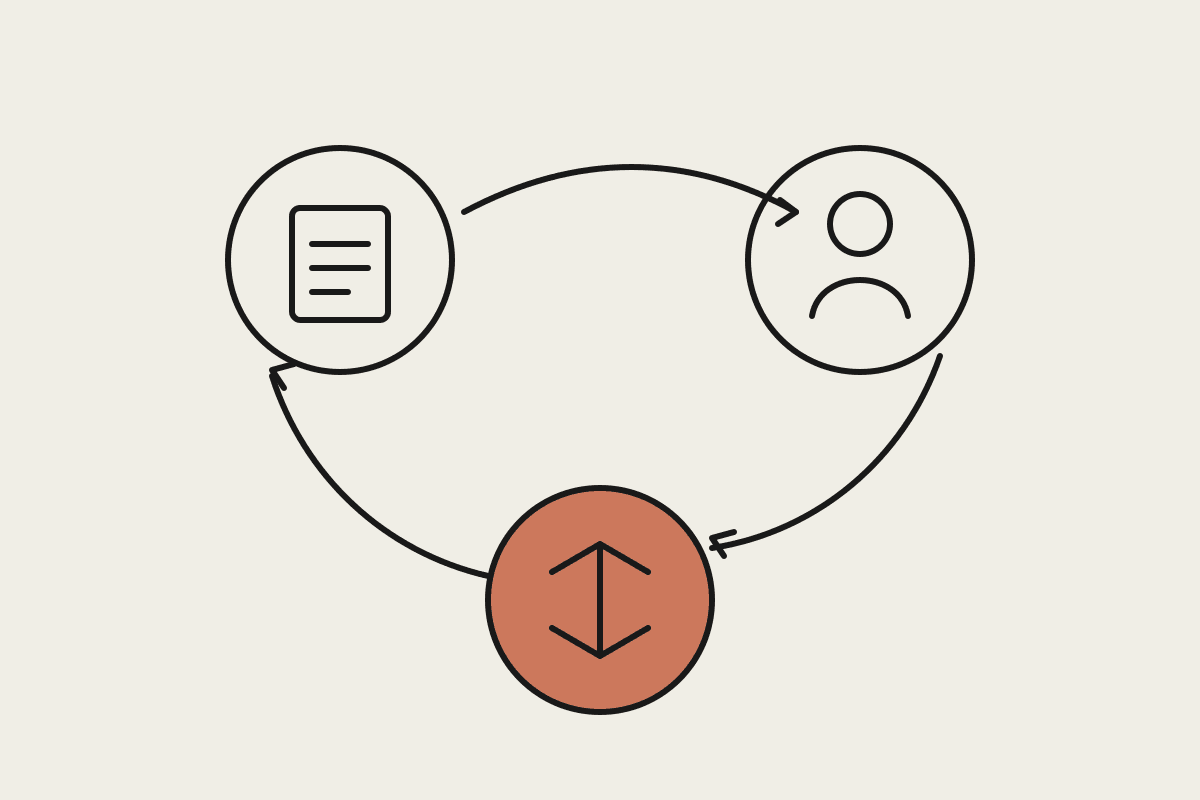
This is about reading Claude adoption across a whole organisation, sales, finance, ops, marketing, not an engineering-manager's code-analytics dashboard, which is a genuinely different question with different signals worth watching. Most businesses that roll Claude out past a pilot group have no structured way of knowing whether adoption is actually spreading or quietly stalling in three departments while looking fine in the aggregate number.
Why the aggregate seat-usage number lies
A business with sixty licensed seats and forty percent "active usage" sounds reasonable until you break it down and find that number is entirely carried by one enthusiastic team while four other departments show essentially zero usage, a pattern the aggregate figure hides completely. Reading adoption properly means looking department by department, and week by week, not settling for one company-wide percentage that averages away exactly the signal that matters.
Active-user percentage broken out by team or department, not just company-wide
Week-over-week trend per team, since a team's usage climbing or declining tells you more than a single snapshot
Which specific use cases are actually driving usage, versus which were pitched in training but never stuck
A simple ratio of licensed seats to genuinely active seats, to catch quiet over-purchasing early
What to actually do once you can see the gap
Finding a department with low adoption is only useful if it leads to a specific next action, and the useful next action is rarely "send another training email," which is the default response most businesses reach for and which rarely moves the number. The more effective pattern is a short, direct conversation with two or three people in the low-adoption team about what specifically they tried, what didn't stick, and what task they'd actually want solved, because low adoption is almost always a mismatch between what was pitched and what the team's real daily friction actually is.
A Melbourne insurance broker rolled Claude Cowork out to eighty staff across five departments and, six weeks in, the aggregate dashboard showed a respectable fifty-five percent active usage that looked like a healthy rollout at a glance. Breaking it down by department showed claims processing at over eighty percent adoption while the underwriting team sat under ten percent, and a short round of conversations revealed the underwriting team's actual daily bottleneck, policy wording cross-checks against a specific set of internal guidelines, had never been covered in the generic training everyone received. Building one narrow skill for that specific task lifted underwriting adoption to sixty percent within three weeks, and the operations lead estimated the broader rollout, done right the first time, was worth roughly $31,000 a year in recovered underwriter time across the team.
Reading a decline, not just a low number
A team's usage climbing steadily then flattening or dropping is a different, often more urgent signal than a team that was simply never engaged, since a decline usually means something specific broke, a connector stopped working, a workflow someone relied on changed, or the person who championed adoption in that team left, and it's worth investigating a decline faster than a flat low number, because the fix is often a single, identifiable technical or people problem rather than a broader engagement gap.
Comparing adoption against the original rollout plan
Most Claude rollouts start with an implicit or explicit list of use cases the business expected each team to adopt, and revisiting that original plan against actual usage data six months in is a genuinely useful exercise most businesses skip, because it's easy to assume the rollout is broadly on track without ever checking the specific use cases against what's actually happening. A team using Claude heavily but only for one narrow task, when three were originally planned, is a different and more specific gap than a team using it for nothing at all.
This comparison also surfaces use cases that quietly failed to land anywhere, not just in one team, which is a useful signal that the use case itself may have been mis-scoped from the start rather than a training or adoption problem specific to any one department.
Setting a review cadence that actually gets looked at
A monthly adoption review, ten minutes, department breakdown, trend direction, one action per low-adoption team, kept on a standing calendar slot with a named owner, catches drift far earlier than an annual or ad hoc check, and the businesses that get the most value from a Claude rollout treat this review as seriously as any other operational metric, not an afterthought nobody circles back to.
What this isn't
This is org-wide adoption tracking across departments, distinct from an engineering-manager's Claude Code usage dashboard, which is a narrower, dev-tool-specific view; if code-specific analytics is what you're after, that's a separate, more technical conversation.
Automata AI sets up org-wide Claude adoption dashboards for Australian businesses past the pilot stage. Get in touch via /contact and we'll show you which department the aggregate number is currently hiding.