Alibaba released Qwen Image 3.0 as an open-weight model on 5 August 2026, and the first question every Australian e-commerce operator asked was whether it could replace a paid image subscription. The honest answer, after running the numbers with a real catalogue, is that it replaces most of one.
Why product photography is the fair test
Product photography is the clearest place to test an open-weight image model, because the brief is narrow and repeatable: consistent lighting, a consistent background, and colour that matches the physical item a customer will receive. Brand campaign imagery is judged on taste, which makes comparisons arguments. A product shot is judged on whether the jug looks like the jug.
That narrowness is why we start cost comparisons here rather than with hero creative. If a model cannot hold a plain white background across 400 listings a month, no amount of GPU saving matters. If it can, the saving is real and measurable in the same month you switch.
What does switching to Qwen Image 3.0 actually cost?
For a Sydney homewares retailer producing roughly 400 new listings a month at three to five images each, a self-hosted Qwen Image 3.0 deployment on Australian cloud GPUs ran about $520 a month in compute against $890 a month for their existing proprietary subscription. The headline saving was $370. Setup consumed roughly two weeks of calibration work before any image was usable, and that cost does not appear on either invoice.
Two weeks is the number most comparisons omit. Colour accuracy out of the box was close but not saleable: whites drifted warm, and glazed ceramics picked up a sheen the physical product did not have. Fixing that meant building a reference set from the retailer's own studio photos and tuning against it, which is engineering time, not a subscription line item.
The table below sets the two options side by side over the first twelve months, which is the window where setup cost still matters.
| Line item | Proprietary subscription | Self-hosted Qwen Image 3.0 |
|---|---|---|
| Monthly platform or compute | $890 | $520 |
| Setup and calibration (one-off) | $0 | $9,600 |
| Colour QA per month | $0 | $180 |
| Year one total | $10,680 | $18,000 |
| Year two total | $10,680 | $8,400 |
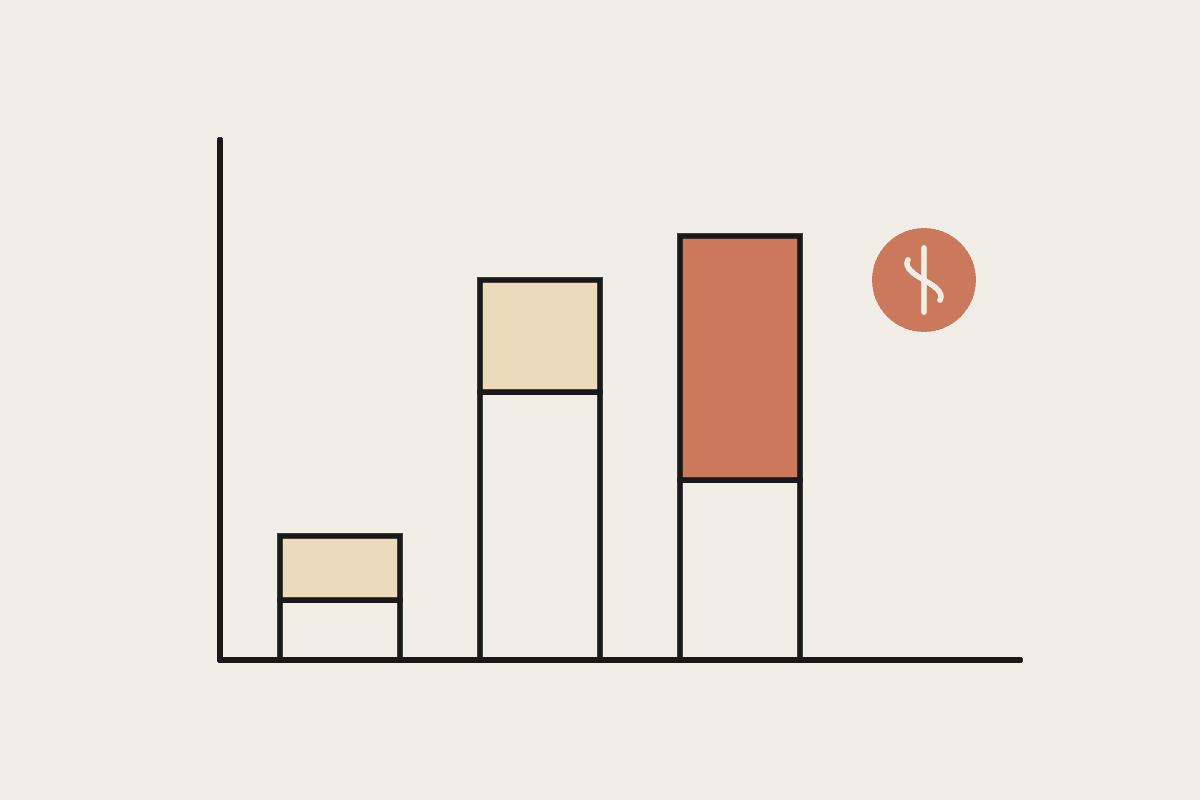
Year one is worse. That is the finding that gets left out of vendor comparisons and out of most enthusiastic write-ups. The switch only pays from month fourteen onward, and only if catalogue volume holds. A retailer planning to sell the business inside two years should not make this change.
Where the saving held, and where it did not
The retailer ended up running a split workflow rather than a clean migration. Standard catalogue shots on a plain background moved to the self-hosted model. Hero images used in paid ad creative stayed on the subscription tool, because a small quality drop measurably hurt click-through in their own A/B testing, and the lost revenue exceeded the generation saving several times over.
Segment image needs before switching tools, rather than treating product photography as one uniform task
Budget calibration time explicitly, since it does not show up in the headline GPU price
Re-test click-through and conversion on any generated hero image before calling a cheaper generation cost a saving
Keep the incumbent subscription running in parallel for at least one full month, so a bad batch does not stall listings
Roughly 80 per cent of the catalogue moved. That partial migration is the outcome we now expect rather than the exception, and it is worth planning for from the start instead of discovering it in month three. Our ROI calculator handles split workflows of this shape if you want to model your own volumes.
What not to conclude from these numbers
This is one retailer, one product category, and one month of pricing. Homewares is a forgiving category: matte surfaces, simple geometry, limited colour range. Apparel on a model, jewellery with specular highlights, or anything where texture carries the purchase decision will behave differently and generally worse. Treat the $370 monthly delta as the shape of an answer, not the answer.
Australian cloud GPU pricing is also moving. The $520 figure assumes on-demand pricing in a Sydney region as at August 2026; committed-use discounts change it materially, and so does the exchange rate on any offshore capacity. Anyone running this calculation in 2027 should redo the compute line rather than inherit ours.
The one conclusion that does travel: the interesting question is not whether an open-weight image model is good enough, it is which slice of your catalogue it is good enough for. That slice is usually large and rarely everything.
How to run this test on your own catalogue
Pull thirty listings that represent the range of your catalogue, not the easy ones. Generate each image both ways, then have whoever normally approves product photos review them blind. If approval rates match within a few percentage points, the slice is a candidate. If they do not, you have learnt that in an afternoon rather than after a migration.
Then price the calibration honestly. Two weeks of engineering time at Australian contractor rates is most of the year-one cost, and underestimating it is the single most common error we see in these business cases.
If you want the comparison run against your own product range before you commit a marketing budget, get in touch and we will scope it. Details of how we structure this kind of work are on our services page.