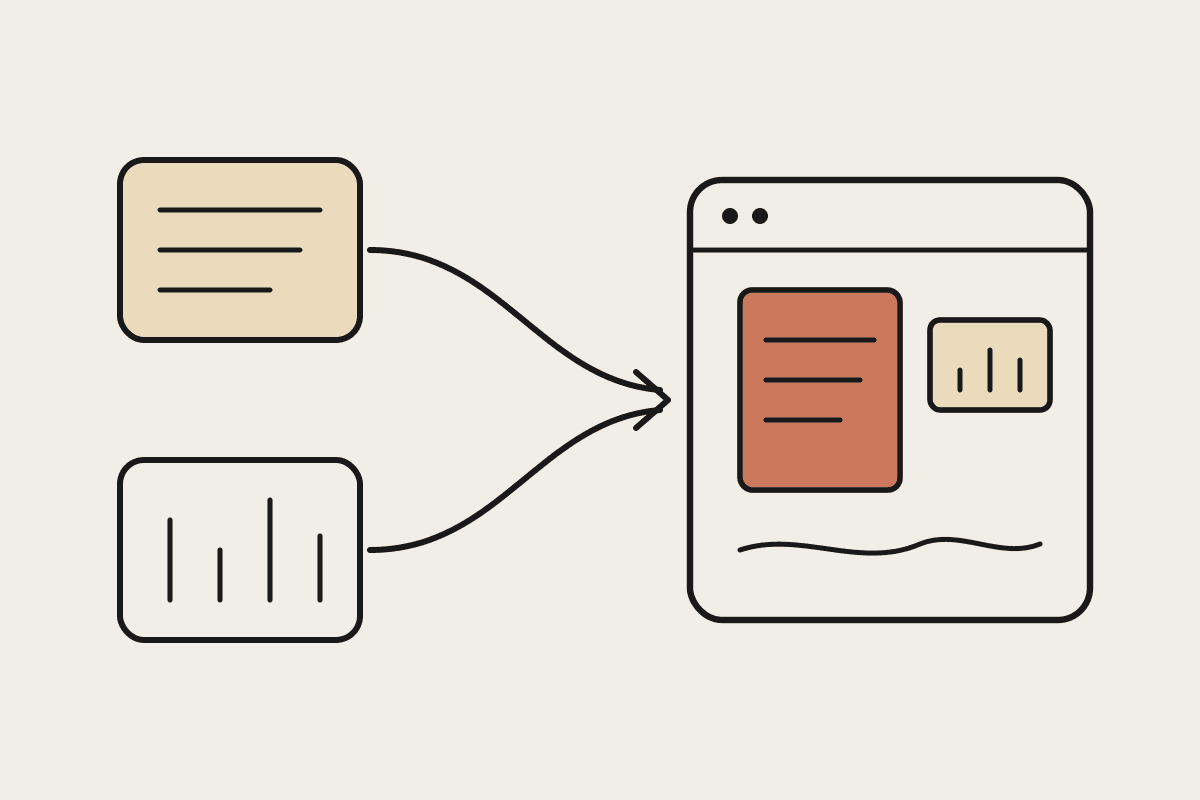
On 16 September 2026, OpenAI added analytics to the ChatGPT Admin Console that put usage, cost, task insights and outcome metrics in one place. It is a sensible release, and it names a problem every Claude customer has too: the board asks what the AI spend returned, and the only thing on hand is a chart of active users.
We run Claude rollouts for Australian businesses, so this is the question we get in month three of almost every engagement. The short version of our answer: a usage dashboard tells you whether people turned up. It does not tell you whether the business got anything. You need both numbers, and the second one never comes out of an admin console on its own.
What did OpenAI actually ship?
According to OpenAI's announcement, the new console views cover ChatGPT Work and Codex:
A Usage view showing active users, credits and tokens.
An Insights task classifier that groups messages into use cases.
Task-detail breakdowns by model, reasoning level and speed, meant to guide training.
A plugin leaderboard and a Skills view.
A Codex Outcomes view tracking Codex's share of merged commits and lines of code against review time, defects and rework.
An Admin plugin and API for custom dashboards and leadership decks.
OpenAI also published a worked example, labelled illustrative: a 20-seller sales team saving 3 hours per account brief produces $207,000 of annual capacity value against a $60,000 first-year cost, or 245% ROI. Customer proof points sit beside it, including 1Password reporting 553% ROI through Codex.
How do you measure Claude ROI in an Australian business?
You measure Claude ROI by pairing two records: what the admin and usage analytics say people did with Claude, and a baseline you took before the rollout of how long the same work used to take and how often it went wrong. The return is the gap between those two, priced at a loaded hourly rate and discounted for hours that were saved but never put to other work.
The usage half is the easy half. We covered how to read it in Claude usage analytics for team adoption. The baseline half is where most pilots fall over, because nobody timed the old process before changing it. If you have not started yet, time ten real examples of each task this week. If you already started, a short time-ledger method can rebuild a usable baseline from people still doing the task the old way.
The same calculation with Australian numbers
Here is OpenAI's format applied to an illustrative mid-market case: a Brisbane commercial builder with 12 estimators using Claude to prepare tender comparisons. Every figure below is illustrative, not a client result.
| Line | Working | Value |
|---|---|---|
| Hours saved per person | 2.5 hours a week over 46 working weeks | 115 hours |
| Gross capacity value | 12 people x 115 hours x $85 loaded rate | $117,300 |
| Realisation discount | Half the saved hours go to billable or tender work | $58,650 |
| First-year cost | Seats, setup, training and review time | $38,000 |
| Headline ROI | ($117,300 - $38,000) / $38,000 | 209% |
| Realised ROI | ($58,650 - $38,000) / $38,000 | 54% |
Both ROI rows are arithmetically correct. Only one of them survives a CFO. The 209% figure assumes every saved hour turns into value, which is the assumption behind most vendor examples, OpenAI's included. The 54% figure asks where the hours went. In this case the builder submitted more tenders with the same team, and that is what makes half the hours real.
Three things a dashboard cannot tell you
Whether the work was any good. Faster tender comparisons that miss an exclusion clause are a cost, so track error and rework rates beside time.
Where the hours went. Saved time that dissolves into the week is not a return. Name the work that absorbed it.
What you would have spent anyway. If a contractor or a new hire was the alternative, the avoided cost belongs in the model. If nothing was, it does not.
The first point deserves its own tracking. We set out the measures in AI ROI beyond hours saved: error rates, cycle times and customer scores sit beside time, because a regulator or a client will judge the output, not the speed. For an APRA-regulated firm, a rework rate is often the more persuasive number.
What not to conclude from the comparison
It would be easy to read OpenAI's release as a feature gap to score. That misses the point. A task classifier and an outcomes view are useful, and Claude's admin analytics cover similar ground on usage and spend. Neither product knows your loaded rates, your baseline or what your people did with the time. That part is your work, whichever assistant you run.
So if you are a Claude customer, there is nothing to migrate and nothing to wait for. Pick two workflows, take a baseline, keep a ledger for six weeks and run the table above with your own figures. Report the realised number, and show the headline one next to it so nobody thinks you hid it.
Where to start
Our ROI calculator runs the same build-up with your team size and rates. If you would rather work through it with someone who has done it for other Australian teams, book a short conversation and bring one workflow you suspect is paying off. We will help you prove it or drop it.